Posts for: #monitoring

Uptime Kuma Releases Version 1.23.9 of Self-Hosted Uptime Monitor

Uptime Kuma Releases Version 1.23.9 of Self-Hosted Uptime Monitor

Uptime Kuma, the self-hosted uptime monitor, has released version 1.23.9, bringing several improvements, bug fixes, and security fixes to the platform.

One important note is that this release may be a breaking change for those using third-party frontends or tools. The WebSocket origin now needs to be the same as your server hostname. However, users can set an environment variable called UPTIME_KUMA_WS_ORIGIN_CHECK to bypass in order to skip this check.

Here are the improvements included in this release:

  • Added an aria-label to the monitor search box, improving accessibility.
  • Added a helptext for the ntfy’s priority field, providing better guidance to users.

The bug fixes in this release are as follows:

  • Corrected the Maintenance Start/End Time Input to Use Explicitly Specified Timezone, ensuring accurate time tracking.
  • Fixed the buttons of ActionsSelect and ActionsInput that had a default type="submit", preventing unintended form submission.

In terms of security fixes, the following updates were made:

  • Changing the password now closes all logged-in socket connections immediately, preventing unauthorized access.
  • The WebSocket server can now only be connected from the same origin, similar to the CORS policy.
  • An environment variable called UPTIME_KUMA_WS_ORIGIN_CHECK has been added, with two options: cors-like (default) and bypass.

Additionally, this release includes other small changes, code refactoring, and comment/documentation updates.

Netdata Unveils Version v1.44.0 of Monitoring System

Netdata, a popular monitoring system, has released version v1.44.0 with several exciting new features and improvements. This release further solidifies Netdata’s position as a leading monitoring solution for servers, Linux, DevOps, and home labs.

One of the major highlights of this release is the significant improvement in performance, surpassing even Prometheus, a well-known monitoring system. Netdata now includes a new streaming protocol called SLOTS, which allows for more efficient metric streaming between children and parents. This reduces overhead on parents by about 30% without impacting the children. Additionally, Netdata now supports multiple compression algorithms, including ZSTD, GZIP, and BROTLI, with ZSTD being the default choice for its balance between compression ratio and CPU consumption.

Another major addition is the introduction of Gorilla compression, a time series data compression technique developed by Facebook for their time series database. When enabled, Gorilla compression provides a 30% reduction in memory usage for Netdata, making it even more efficient compared to Prometheus.

Netdata now also has improved support for handling large systemd-journal databases, making it more capable of dealing with huge log volumes. The systemd-journal.plugin has been optimized for performance in such environments, providing prompt responses to queries. Netdata’s logs have also been rewritten to log to the systemd-journal, allowing for easy monitoring and analysis using Netdata’s systemd-journal.plugin user interface.

A new utility called log2journal has been introduced in beta, allowing the conversion of log files into structured systemd-journal log entries. This powerful tool supports processing various log formats, including JSON and logfmt logs, and can be used to extract, convert, transform, and send logs to systemd-journal.

Netdata has also expanded its range of functions, offering new ways to visualize and troubleshoot system metrics. These functions leverage the wide range of collectors and metrics available in Netdata, providing insights into disk I/O activity, resource utilization of containers and virtual machines, IPMI sensor readings, disk usage for mount points, network traffic, process resource usage, and more.

In addition to these feature enhancements, Netdata has added new alert notification integrations to Netdata Cloud, including Amazon Simple Notification Service (Amazon SNS) and Telegram. These integrations provide users with more options for receiving alert notifications from Netdata.

It’s worth noting that some changes have been made in this release, including the removal of the charts.d/nut collector, which has been replaced by go.d/upsd. Netdata’s internal metrics are now disabled by default to reduce data volume, and Gorilla compression will be enabled by default in the next release. Some exporters, such as Google Cloud Pub Sub and AWS Kinesis, will be removed in the next release, and database modes map and save will also be eliminated. Furthermore, per-core CPU metrics will be disabled by default to improve performance, and several eBPF.plugin modules have been disabled to optimize system performance.

Overall, Netdata’s v1.44.0 release brings significant improvements in performance, log handling, compression, and functionality, making it an even more powerful and efficient monitoring system for servers, Linux, DevOps, and home labs.

For more details and to download the latest release, visit the Netdata GitHub page.
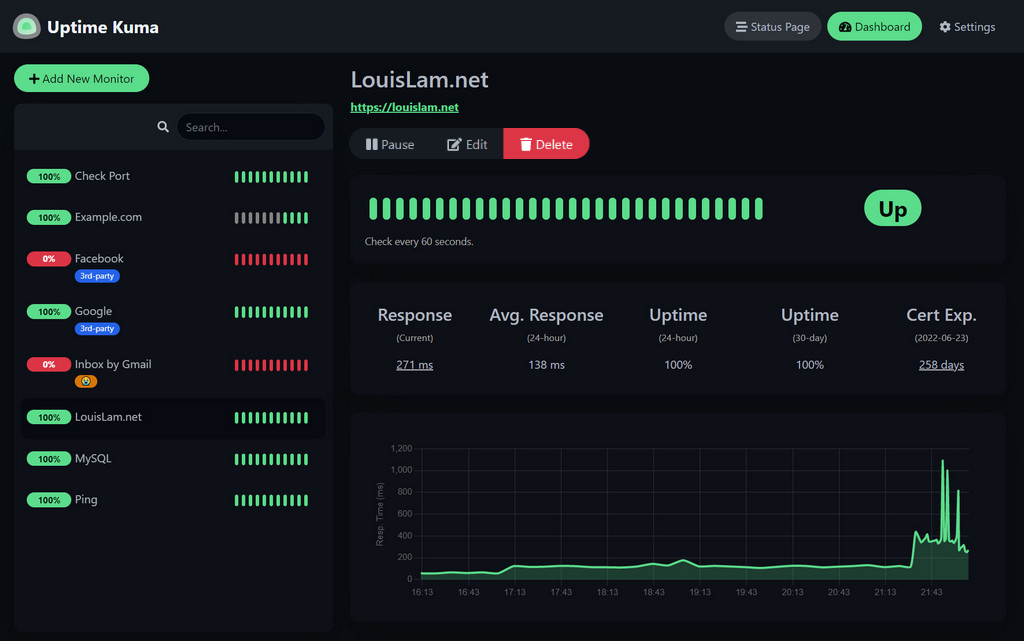
Uptime Kuma Releases Version 1.23.7

Uptime Kuma has recently released version 1.23.7, bringing a range of improvements, bug fixes, and security fixes to the popular server monitoring tool.

In terms of improvements, version 1.23.7 includes the ability to show the original timeout message and adds an additional 10 seconds for the abort signal. This enhancement allows users to better understand and manage timeout issues. Additionally, the error message on abort signal timeout has been improved, thanks to the contribution of @chakflying.

In the bug fixes category, Uptime Kuma has addressed a memory leak issue by ensuring the client postgresql connection is closed after rejection. This fix was made possible by the contribution of @mvaled. Furthermore, the team has decided to revert the “Restart running monitors if no heartbeat” feature, as it was causing issues from version 1.23.4 to 1.23.6.

In terms of security fixes, Uptime Kuma has taken steps to address multiple vulnerabilities. First, an XSS issue in the “Google Analytics ID” text field has been resolved, thanks to the report by @gtg2619. More details about this fix can be found in the advisory GHSA-v4v2-8h88-65qj. Additionally, the Tailscale ping has been rewritten using spawnSync, addressing a security vulnerability reported by @vaadata-pascala. Further information on this issue can be found in the advisory GHSA-hfxh-rjv7-2369. Lastly, Uptime Kuma has made certain functions, such as getGameList and testChrome, only accessible with login, improving overall system security.

Aside from these significant updates, version 1.23.7 also includes various small changes, code refactoring, and comment/documentation updates to enhance the overall user experience.

Grafana Releases Version 10.2.0 of Open-Source Monitoring Platform

Grafana has released version 10.2.0 on October 24, 2023. This new release brings a wide range of features and enhancements to the open-source platform for monitoring and observability.

Some of the key features and enhancements in version 10.2.0 include:

  • The Canvas feature has been promoted to beta status, allowing users to create rich, interactive dashboards with custom visualizations.
  • Improvements to the BarChart component, including enhanced data links in tooltips for better user experience.
  • Updated PluginExtensions to ensure the default timeZone is passed in the context.
  • PublicDashboards feature has been enabled by default for general availability, and the public preview text has been removed.
  • The Grafana UI has added a new Avatar component for user profile images.
  • Alerting now includes support for msteams contact point in external Alertmanagers.
  • The Insights landing page for Alerting has been enabled by default.
  • Various transformations have been improved, including de-emphasizing non-applicable transformations, using short units in graphs, and adding context and timezone support in Format time and Convert field type transformations.
  • Playlist now includes create and update timestamps in the database.
  • Live now allows users to set the engine password.
  • Auth has enabled the None role for version 10.2.
  • Playlist has added support for adding folder, dashboard, and data source permissions to service accounts.
  • SparklineCell now displays absolute values.
  • Various bug fixes and improvements have been made throughout the platform.

In addition to these features and enhancements, there have been bug fixes and improvements to the platform, including fixes for issues related to snapshots, Loki, alerting, transformations, and more.

Please note that there are some breaking changes and deprecations in this release. It is important to review the release notes and update any relevant configurations or code to ensure compatibility with version 10.2.0.

For more details on the new features, enhancements, bug fixes, and breaking changes in Grafana version 10.2.0, you can refer to the release notes.

Netdata Unveils Latest Update: Version v1.43.0

Netdata has released version v1.43.0, which is the most robust and reliable version of Netdata yet. This release includes several improvements and new features that enhance the performance and functionality of Netdata.

One of the major improvements in this release is the enhancement of the systemd-journal logs. Netdata has rewritten the systemd-journal plugin to improve its performance and visualization capabilities. This allows for better visualization of critical systems and security information. Additionally, Netdata is standardizing the way logs are handled as part of the platform, which enables support for more log management engines like Loki and Elasticsearch.

Another notable improvement is the changes made to the way metrics are collected and exposed in the Netdata Agent UI. This allows for easier slicing and dicing of data and better compatibility with OpenTelemetry specifications. The apps.plugin now exposes charts in the Applications section of the dashboard using the NIDL framework, while systemd units charts have been updated to have an instance for each systemd unit. Disk charts also have additional labels to help identify disks from the charts.

The Netdata Health engine has also undergone changes to improve integration with the new dashboard. These changes include better multi-node alerting on parents and the ability to evaluate and configure alerts directly from the UI.

In terms of performance, Netdata now has lower resource utilization, including lower memory usage and disk footprint. The self-vacuuming of SQLite databases has also been implemented. Notably, Netdata now requires only 1 pointer for each use of a label name-value combination, significantly improving memory requirements in setups like busy Kubernetes clusters.

Other improvements include the ability to run a 32-bit Netdata on a 64-bit IoT operating system, the availability of Netdata Cloud to be installed on-premises, and enhancements to VMware vSphere monitoring.

Looking ahead, Netdata is working on several areas for future releases. These include the development of a Logs Explorer for Loki and Elasticsearch, allowing for exploration, querying, and visualization of logs from these sources. Netdata is also working on making all integrations configurable via the dashboard and allowing alerts to be configured directly from the UI. Additionally, Netdata is preparing to release a mobile app for receiving push notifications and exploring alert statuses. The scalability of Netdata in larger environments is also a focus for future improvements.

As part of the release, there are also deprecation notices for certain components and changes that will be implemented in future releases. These changes aim to improve the functionality and usability of Netdata.

Overall, the release of Netdata version v1.43.0 brings significant improvements and new features that enhance the performance, functionality, and usability of Netdata for server monitoring and management.

Uptime Kuma Launches Version 1.23.3

Uptime Kuma has released version 1.23.3, bringing several bug fixes and security enhancements. This update includes important changes that users need to be aware of.

First and foremost, due to the security fix in this version, all login sessions will be logged out after updating. This is a necessary measure to ensure the security of the system. Users will need to log in again with their credentials to access the platform.

It is worth noting that if you are using any unofficial or third-party tools with Uptime Kuma, there is a possibility of breaking changes with this update. In such cases, it may be necessary to re-generate an authentication token to ensure seamless integration with these tools.

Now let’s take a closer look at the bug fixes included in this release:

  • Fixed an issue where notifications were not working if the configuration was too long. This bug has been resolved thanks to the contribution of @FJBlok.
  • Enabled the status page certificate expiry badge for all HTTP(s) monitors. This improvement was made possible by the work of @marvinruder.
  • Addressed Kafka producer bugs, ensuring smoother operation of this feature. This fix was made possible by the contributions of @mhkarimi1383.
  • Fixed an issue with the incorrect usage of x-forwarded-host. This bug has been resolved thanks to the efforts of @xuexb.
  • Resolved a race condition issue in the status page editor, ensuring that all data is saved correctly. This fix was made possible by the contribution of @chakflying.

In addition to these bug fixes, version 1.23.3 also includes security enhancements. One of the notable security fixes is the resolution of a persistent session tokens issue. Previously, there was no way to revoke session tokens even if the password was changed. With this update, users can now revoke session tokens by changing their password. For more information on this security fix, you can refer to the advisory GHSA-g9v2-wqcj-j99g.